Soil Health
How to Read a Soil Test Report: pH, Nutrients and What to Do Next
How to take a representative soil sample, what each line of a lab report means, how to interpret pH, CEC, organic matter and nutrient levels, and how to turn the numbers into a sensible amendment plan.

Published October 18, 2026 · 8 min read
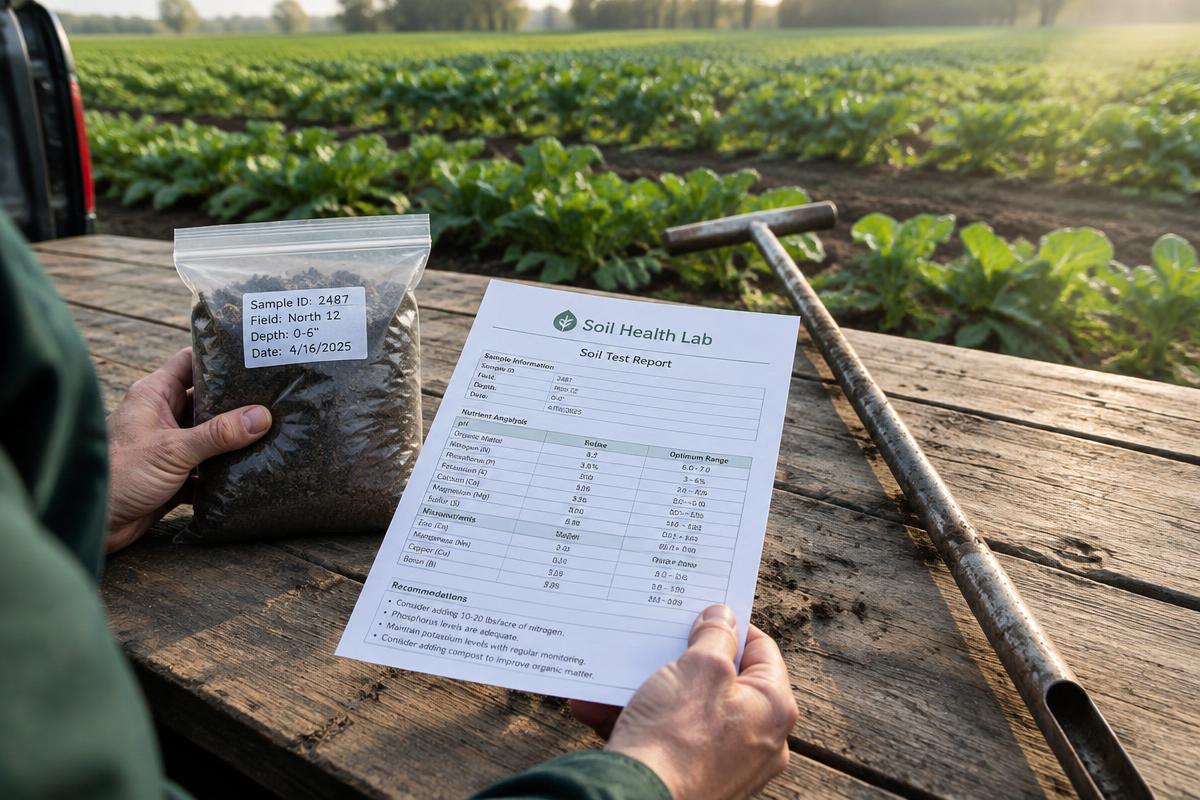
A soil test report is one of the cheapest and most useful documents a grower can own. For the price of a few bags of fertilizer, a laboratory will tell you what your soil holds, what it lacks and, just as important, what you are already applying in excess. Yet many reports end up in a drawer because the page of numbers, abbreviations and ranges looks more like a chemistry exam than a field tool. This guide walks through the report line by line, explains what each figure means for crops, and shows how to turn it into a practical amendment plan.
The goal is not to become a soil chemist. It is to read the report with enough confidence to ask good questions, avoid the most common and expensive mistakes, and track whether your soil is improving from one year to the next.
Why a Soil Test Beats Guesswork
Without a test, fertility decisions rest on habit: the same bag of balanced fertilizer every spring, a generous layer of manure because it worked last year, lime because a neighbor limes. Habits like these frequently push nutrients out of balance. Phosphorus is the classic example. Soils that receive manure or compost every season often accumulate phosphorus far beyond what crops need, and excess phosphorus can run off into waterways and interfere with the uptake of zinc and other micronutrients. The grower who never tests keeps adding it anyway.
A test also saves money in the opposite direction. When a field shows adequate potassium, there is no reason to buy potash this year. Over a few seasons, skipping unnecessary inputs typically pays for the testing many times over. And because a report is a dated record, it becomes the baseline against which every future practice, from cover crops to compost, can be measured.
Taking a Sample That Means Something
The laboratory can only analyze what you send it, so the accuracy of the report begins in the field. A single scoop of soil from one spot tells you about that spot and nothing more. A useful sample is a composite: fifteen to twenty small cores taken in a zigzag pattern across one management area, mixed in a clean plastic bucket, with about two cups of the mixture sent to the lab.
Define management areas by how the land is treated, not by fence lines. A market garden bed block, a hay field and an old orchard should each be sampled separately, because they receive different inputs and will tell different stories. Avoid unusual spots that would distort the average: old manure piles, burn sites, fertilizer spills, gateways and field edges.
Depth matters. For most vegetable and field crops, sample the top fifteen centimeters, roughly the depth of tillage or of the most active root zone. For permanent pasture or no-till systems, many labs suggest a shallower sample because nutrients and lime concentrate near the surface. Whatever depth you choose, use the same depth every time so results remain comparable.
Timing matters too. Sample at the same time of year, ideally autumn or early spring, and avoid sampling right after applying fertilizer, lime or manure. Label every bag clearly with the field name and date, and keep a simple map. The report you receive in three weeks is only as useful as your ability to match it to a place.
pH: The Master Variable
If you read only one number, read pH. It measures soil acidity or alkalinity on a scale where 7 is neutral, lower numbers are acidic and higher numbers are alkaline. The scale is logarithmic, so a soil at pH 5.5 is ten times more acidic than one at 6.5.
pH matters because it controls nutrient availability. Most vegetables and field crops perform best between about 6.0 and 7.0, the window in which the majority of nutrients are readily available and soil biology is most active. Below that range, phosphorus becomes locked up, aluminum and manganese can reach toxic levels, and nitrogen-fixing bacteria struggle. Above it, iron, manganese, zinc and phosphorus become less available, which is why crops on alkaline soils often show yellowing between leaf veins.
Many reports list a second figure called buffer pH. This does not describe your soil's current acidity; it estimates how strongly the soil resists change. A clay soil rich in organic matter needs far more lime to raise pH by one unit than a sandy soil does, and the buffer pH is how the lab calculates the lime recommendation.
On alkaline and calcareous soils, common in arid regions including much of Egypt and the Middle East, the challenge is reversed. Lowering pH across a whole field is slow and costly, so growers usually work with the soil rather than against it: adding organic matter, using acidifying fertilizers such as ammonium sulfate where appropriate, applying elemental sulfur to beds of sensitive crops, and supplying micronutrients like iron in chelated forms that remain available at high pH.
CEC and Organic Matter
Cation exchange capacity, abbreviated CEC, describes how many positively charged nutrients, such as calcium, magnesium and potassium, the soil can hold on its clay and organic particles. Think of it as the size of the soil's pantry. Sandy soils often have a CEC below 5, meaning they hold little and lose nutrients quickly to leaching. Clay and humus-rich soils can exceed 20, storing nutrients for long periods.
CEC changes how you fertilize. On a low-CEC sand, large single applications are wasted because the soil cannot hold them; smaller, more frequent feeding works better. On a high-CEC clay, nutrient levels change slowly, so corrections take time and a single season's application rarely shows dramatic results.
Organic matter is usually reported as a percentage. Most cultivated mineral soils fall between one and six percent, and arid-region soils are often below one percent. Small changes matter: raising organic matter by even half a percentage point improves water holding, nutrient retention and soil structure noticeably. Because organic matter builds slowly, this is the number to watch over five or ten years as a measure of whether cover crops, compost and reduced tillage are working.
Phosphorus, Potassium, Calcium and Magnesium
Nutrient results are commonly shown as a number alongside a rating such as very low, low, optimum, high or very high, often with a bar graph. Pay attention to the rating more than the raw figure, because different labs use different extraction methods, and a phosphorus value from one method cannot be compared directly with another. If you change laboratories, expect the numbers to shift even if the soil has not.
Phosphorus (P) drives root growth, flowering and seed formation. A low rating justifies an application; a high or very high rating means you should stop adding phosphorus, including through heavy manure or compost use, until levels fall.
Potassium (K) supports water regulation, disease resistance and fruit quality. Heavy-feeding crops such as tomatoes, potatoes and squash remove large quantities, so market gardens often drift low over time without replenishment.
Calcium (Ca) and magnesium (Mg) are usually adequate in soils with proper pH, because liming materials supply them. Some reports show the percentage of the CEC occupied by each nutrient, called base saturation. These figures are useful for spotting extremes, such as very low magnesium on sandy soils, but chasing an exact ideal ratio rarely pays. Research generally supports correcting real deficiencies rather than fine-tuning balances.
Nitrogen, Salts and Micronutrients
Many standard tests do not report a nitrogen value, or report only nitrate at the moment of sampling. That is because soil nitrogen changes rapidly with temperature, moisture and biological activity; a figure from March says little about July. Nitrogen recommendations are therefore usually based on the crop to be grown, its expected yield and the field's history, including any legume cover crops or manure applied.
Soluble salts, often reported as electrical conductivity (EC), deserve close attention in irrigated and arid areas. High EC indicates salt accumulation that restricts water uptake and stunts sensitive crops such as beans, strawberries and carrots. Sodium may be reported separately; high sodium damages soil structure, causing crusting and poor drainage. Managing salinity typically involves good drainage, leaching with quality irrigation water and, for sodic soils, gypsum.
Micronutrients such as zinc, iron, manganese, copper and boron are needed in tiny quantities, and deficiencies are often tied to pH rather than true scarcity. Correct pH first where possible, and apply micronutrients only when the test and crop symptoms agree, because the gap between enough and toxic is narrow, especially for boron.
Reading the Recommendations Critically
Most reports finish with recommendations expressed in kilograms or pounds of nutrient per hectare or acre for the crop you named on the submission form. These are a good starting point, but read them with care. Note whether the figure refers to the nutrient itself or to a product: a recommendation of 50 kilograms of phosphate per hectare is not the same as 50 kilograms of a fertilizer that contains phosphate.
Consider what the recommendation cannot know. It does not know you plan to spread compost, that a vigorous legume cover crop preceded the field, or that you irrigate with water that carries its own salts. Subtract nutrients supplied by your own inputs before buying more. Labs that serve commercial growers may also lean toward generous recommendations; university and government extension labs tend to recommend only what research shows will produce a yield response.
Turning the Report into a Plan
Work through the report in a fixed order. First, correct pH if it falls outside the crop's range, because nothing else works efficiently until it does. Lime takes months to react, so autumn application is ideal for spring crops. Second, address any very low ratings for phosphorus or potassium. Third, check salts and sodium on irrigated land. Fourth, commit to the long game of building organic matter.
Write the plan beside the report and file both together. Retest every two to three years on the same fields, at the same depth and season, using the same laboratory. Over time the reports become a story about your farm: pH stabilizing, phosphorus drifting back into the optimum range, organic matter creeping upward. That trend line, not any single number, is the real value of soil testing, and it turns fertility from guesswork into management.
Key takeaways
- ◆A composite sample of 15 to 20 cores per management area, at a consistent depth and season, is the foundation of a useful report.
- ◆pH is the master variable: correct it first, because it controls the availability of nearly every other nutrient.
- ◆Buffer pH, not soil pH, determines how much lime the soil needs.
- ◆CEC tells you how much the soil can hold and how often to feed; organic matter is the best long-term progress measure.
- ◆Subtract nutrients from compost, manure and cover crops before following a lab's fertilizer recommendation.
Frequently asked questions
How often should I test my soil?+
Every two to three years for established fields, and every year when correcting a serious problem or starting a new intensive garden. Use the same lab, depth and season so results are comparable.
What is the ideal soil pH for vegetables?+
Most vegetables grow best between about 6.0 and 7.0. Some crops, such as potatoes and blueberries, tolerate or prefer more acidic soil, while brassicas tolerate slightly alkaline conditions.
Why does my report not show nitrogen?+
Soil nitrogen changes rapidly with weather and biology, so a single measurement predicts little. Nitrogen recommendations are usually based on the crop, expected yield and field history instead.
Can I compare results from different laboratories?+
Not directly. Labs may use different extraction methods that produce different numbers for the same soil. Compare ratings rather than raw values, and stay with one lab for tracking trends.
Keywords
- how to read a soil test
- soil test interpretation
- soil pH and lime
- cation exchange capacity
- soil sampling method
- soil organic matter
Related reading
Soil Health
The Soil Microbiome: What Every Farmer Should Actually Know About the Life Underground
Bacteria, fungi, protozoa and nematodes run the nutrient cycle beneath every field. Here is what they actually do, how to read a soil biology test and the four practices that reliably feed them.
July 17, 2026 · 13 min read
Soil Health
Composting on a Working Farm: Systems That Actually Scale
Backyard piles do not translate to farm scale. A working agronomist's guide to windrow composting, C:N ratios, temperature management, and turning finished compost into a real soil-health tool.
July 12, 2026 · 12 min read

Soil Health
Building Healthy Soil: A Practical, Working-Farm Guide
How real farms build living, productive soil — a field-tested guide to soil biology, organic matter, cover crops and testing you can actually use this season.
May 14, 2026 · 12 min read